2011’s power generation in review

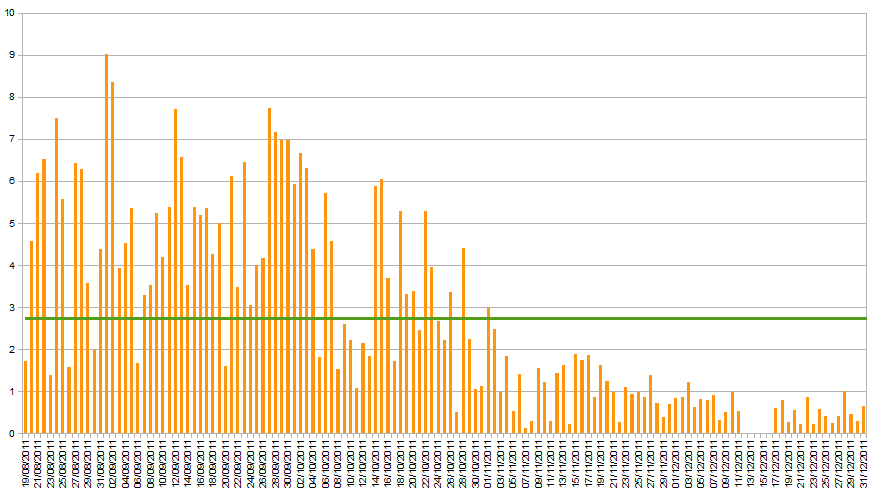
Looking back at 2011, it is interesting to see the difference between daily generation totals the months before November and those during November and December.  You can pretty much draw a line between the 2nd and 3rd November to separate the two levels.

The green line of the chart shows the average (mean) value of daily generation – about 2.7 kWh.  Given we had the panels fitted late in summer, I’d expect 2012 to be a higher average.

Looking back at January and December

I’ve realised that I didn’t produce a graph for the month of December, so I will be looking at both December and January in this post.

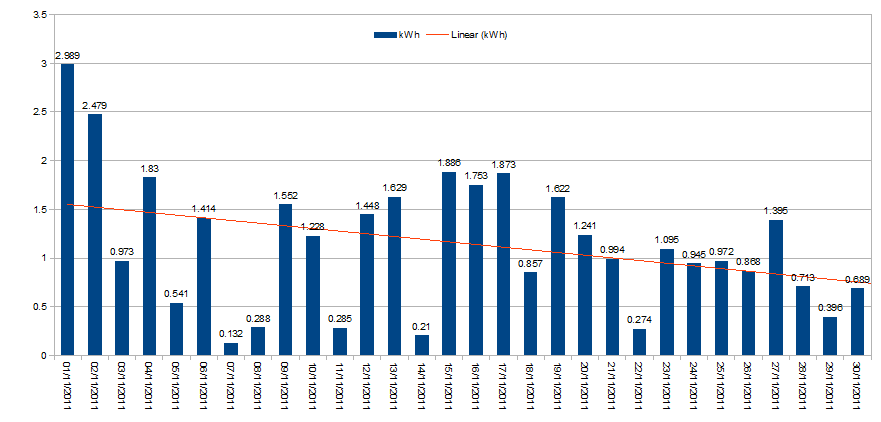
When I looked at the power generation graph for November, the overall trend-line was going down.  In December this trend continued with the trend dropping from about 0.7 to less than 0.4 kWh generated per day.  There were a few days where we reach near to or exceeded 1 kWh, but a lot of the days were fairly grey.  For 5 days (12-16th Dec) our wireless (Sunny Beam) display had a flat battery because I’d not connected it for a week or so to charge it, but it generated approximately 3 kWh during those days (i.e. an average of about 600 Wh each day) which is not reflected in the graph below and the lack of those values will almost certainly have skewed the trend downwards.
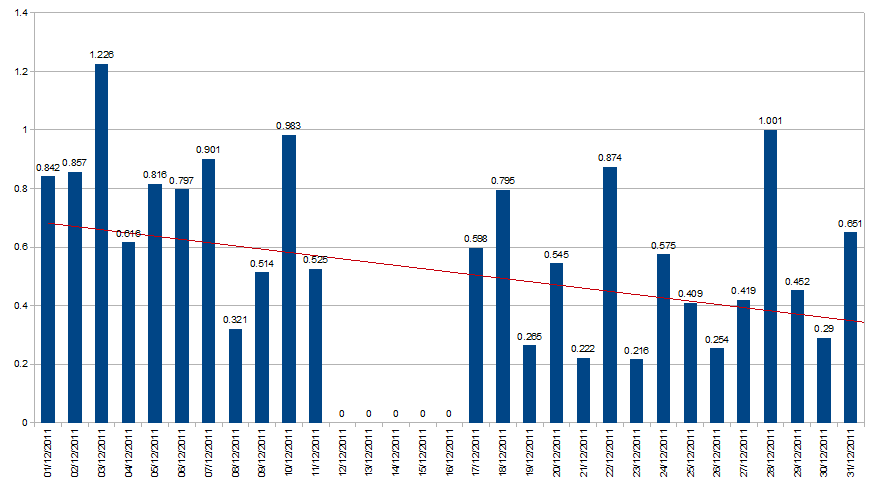
 

In January however, the trend line on already on its way up – note that the zero figures for the 10th, 11th and 12th are, like in December, an error where no figures were recorded because the device’s battery ran out. In both cases though, they were still recorded in the total by the official meter.  It looks like those missing days in January averaged about 400 Wh each (i.e. about 1.2 kWh total).
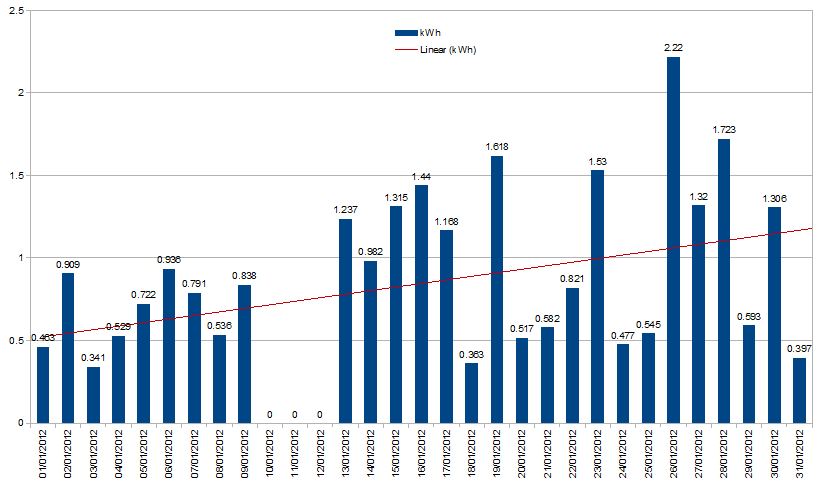
 

Even without those figures the trend increased from just over 0.5 kWh to about 1.2 kWh.  26th January was, as previously posted, the highest generation figure of 2012 (and the highest since the first two days of November) at 2.22 kWh.
A month in review: October 2011

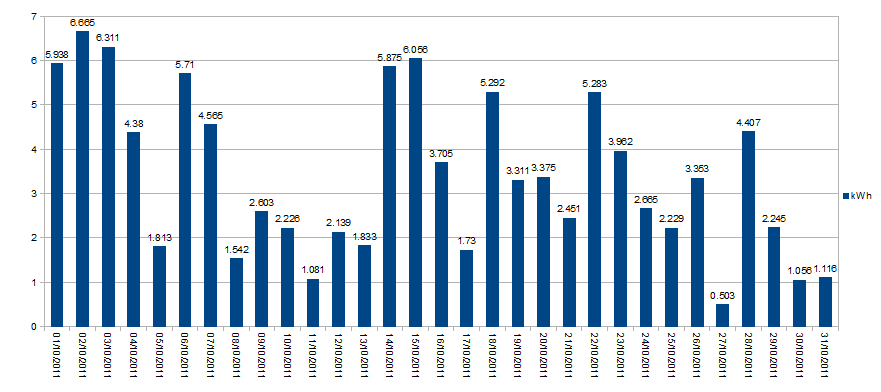
After the hot start to October, it’s been a bit more of the tradition mix of warm and cold day, with some noticeably grey ones, resulting in several days below 2Kwh total, and with significant dips during the day and thus relatively low figures.  The 27th, when only 0.5Kwh was generated was the worst generating day so far:


To date we have generated 320Kwh and saved over 158kg of CO2.  Comparing October to September, in September the average kWh generated per day was 5.18, in October it was 3.40.

Week 4 and The End of the First Month

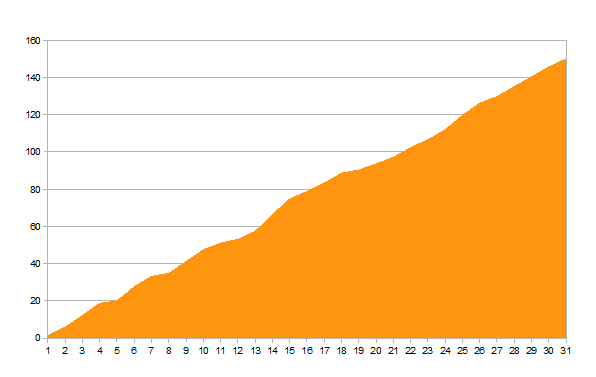
So we’ve had our solar panels for a month now, and yesterday (the 18th) we reached 150KWh generated.

Looking at the cumulative power generation over the month, I was surprised that the line is straighter than I expected – although you can see some of the plateaus.


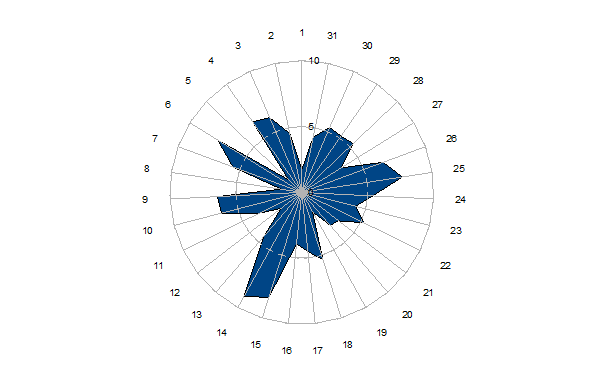
More interesting is the polar view graph, showing the higher generating days quite clearly, and the sudden drops inward on the less good days:

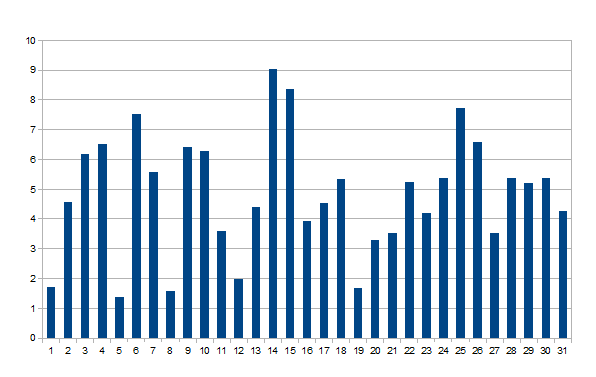
Finally is the more traditional bar graph of the last month:

Day 23 / End of week 3

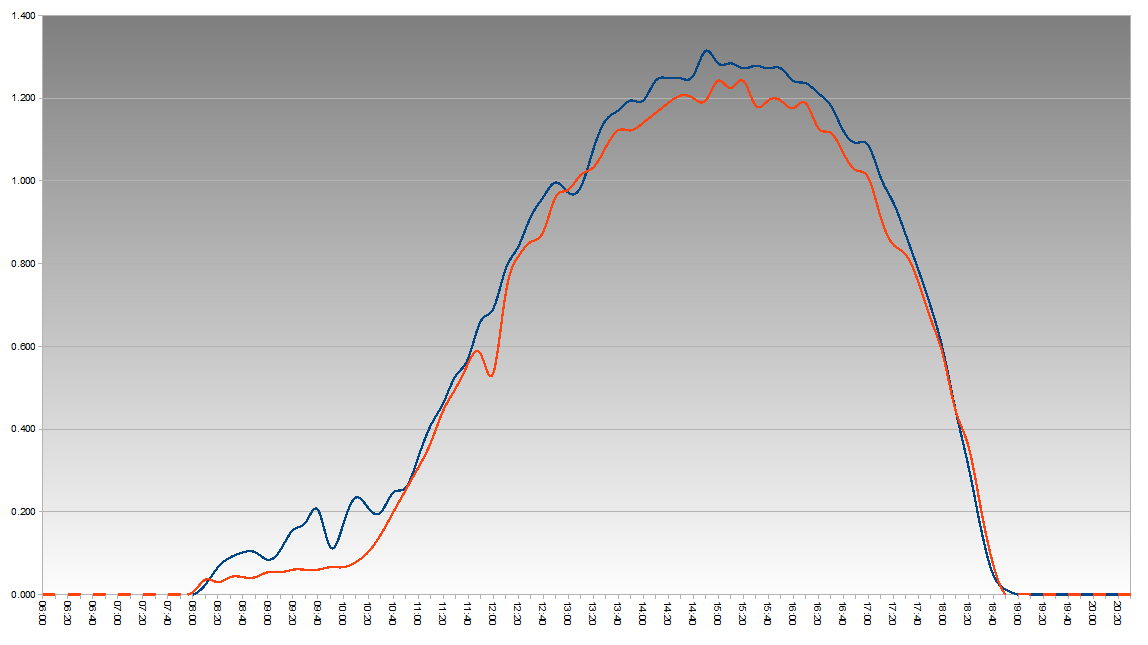
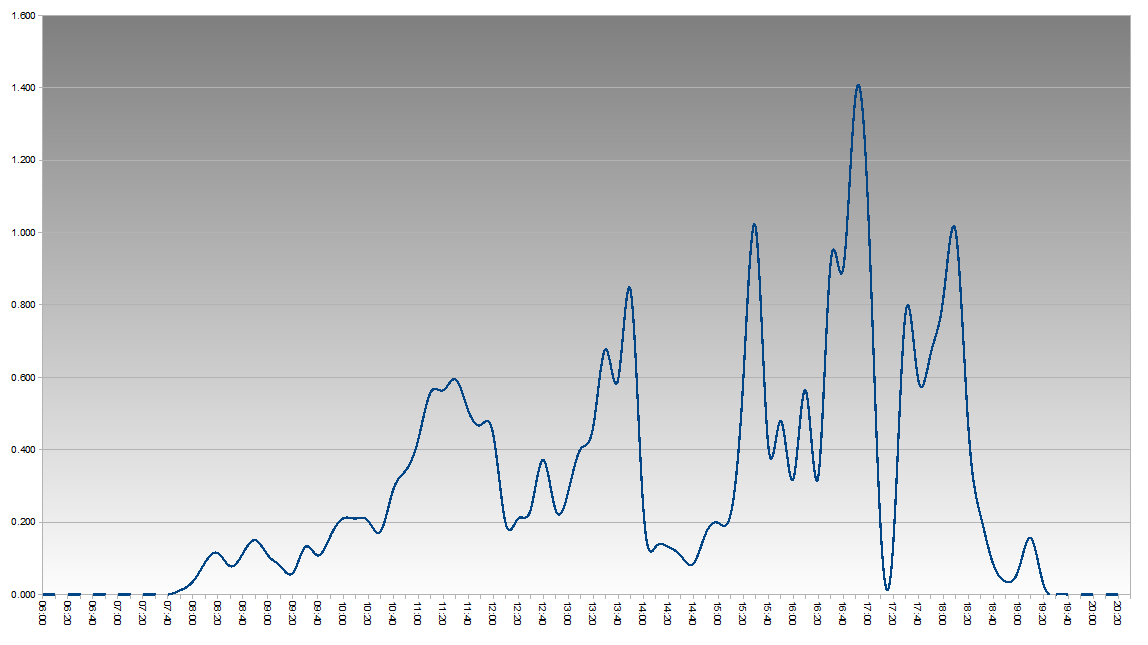
I’m going to update weekly from now on, unless there is something blog-worthy before that, and I’ll probably do a bar graph of the weeks values rather than a line graph for each day.  That said, today’s graph is below:

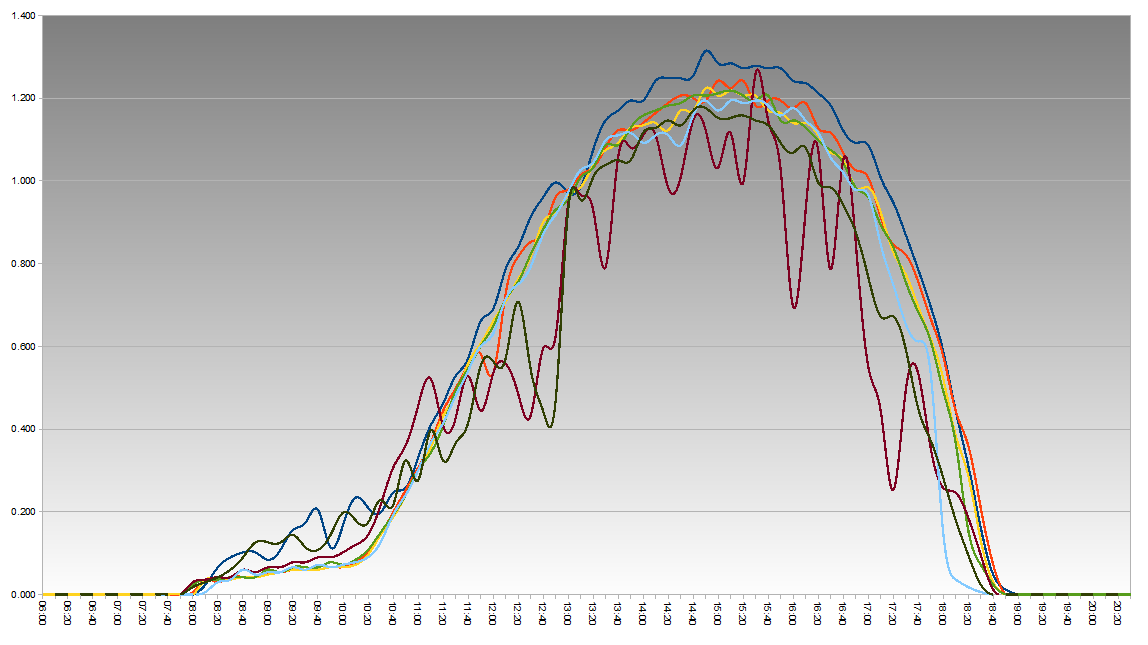
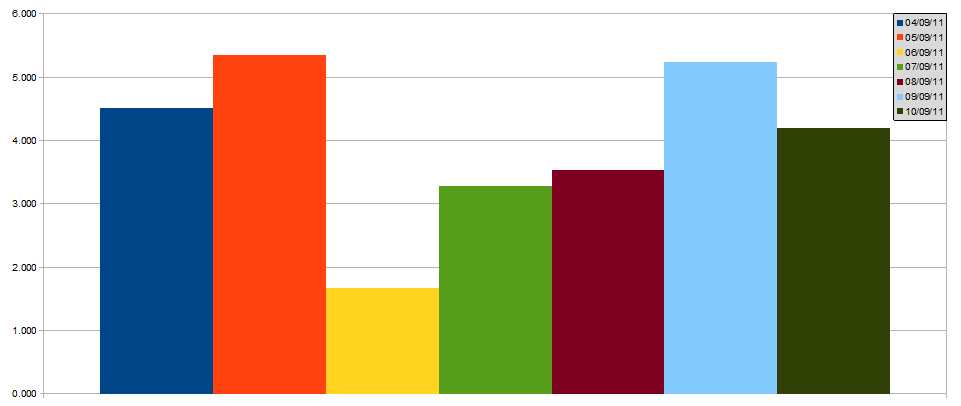
Looking back at this week (Sunday – Saturday), here’s a daily comparison:

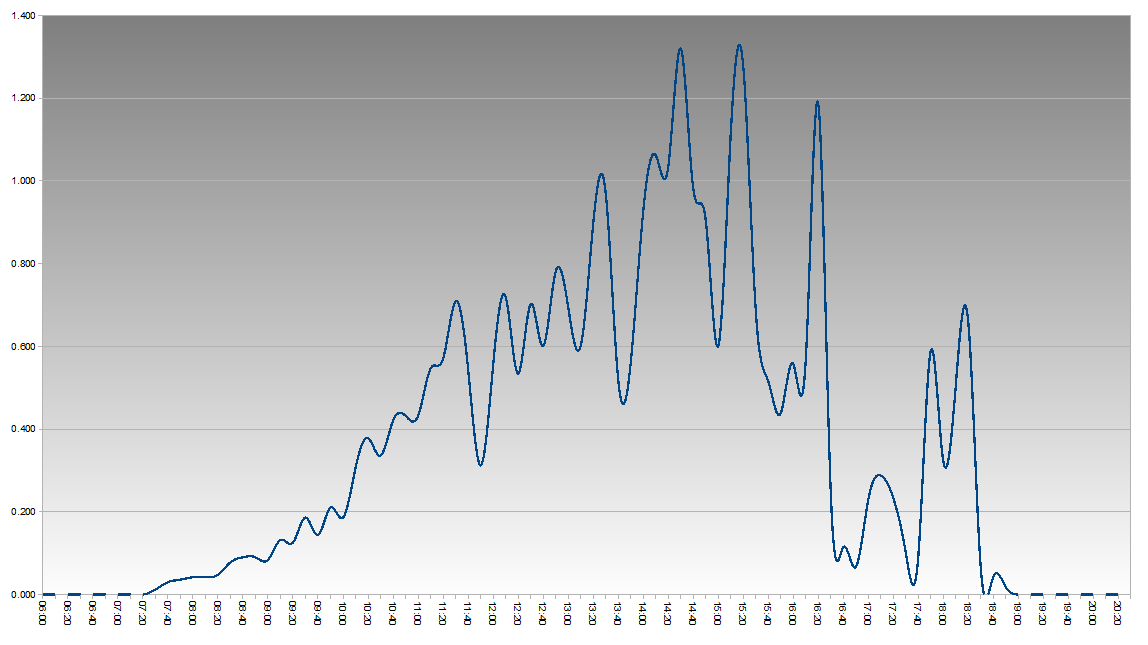
Power generated today: 4.204KW

Power generated so far: 106.85KW