Day 15 – Another great one!

Today was another great day for our solar system – we generated less than yesterday, but still more than enough to put it firmly in second place.  If only every day could be like the today and yesterday…

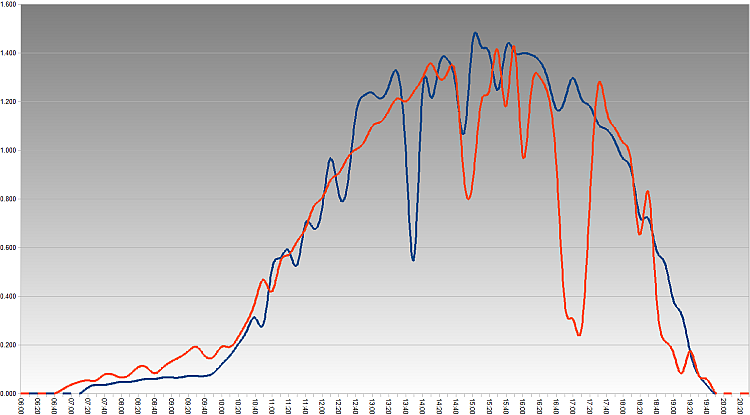
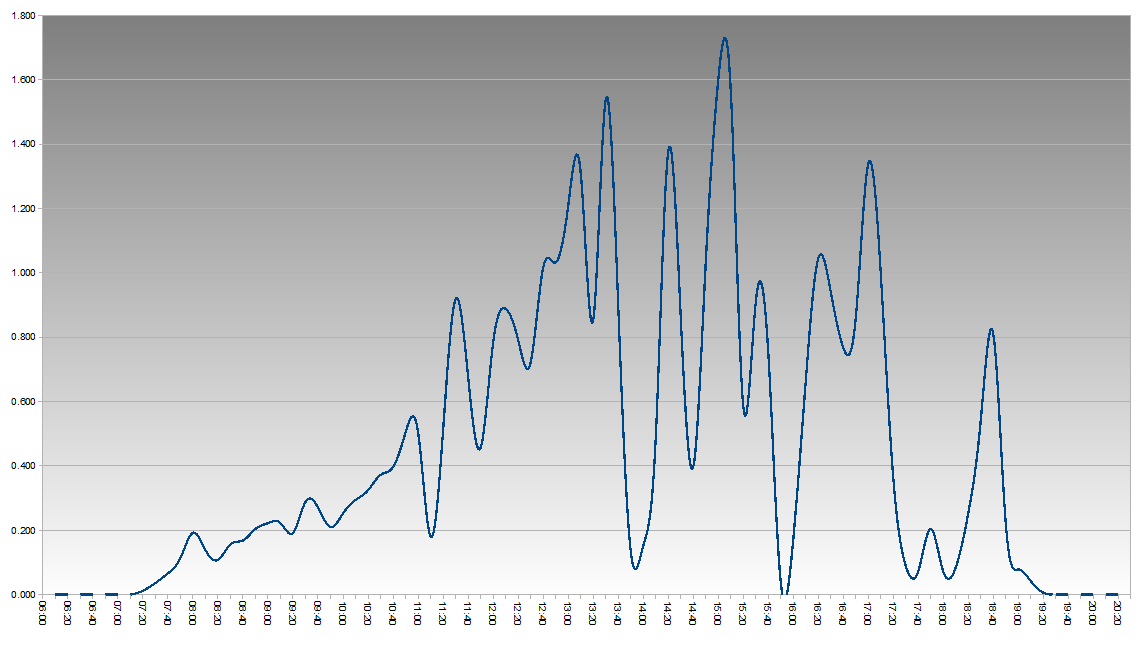
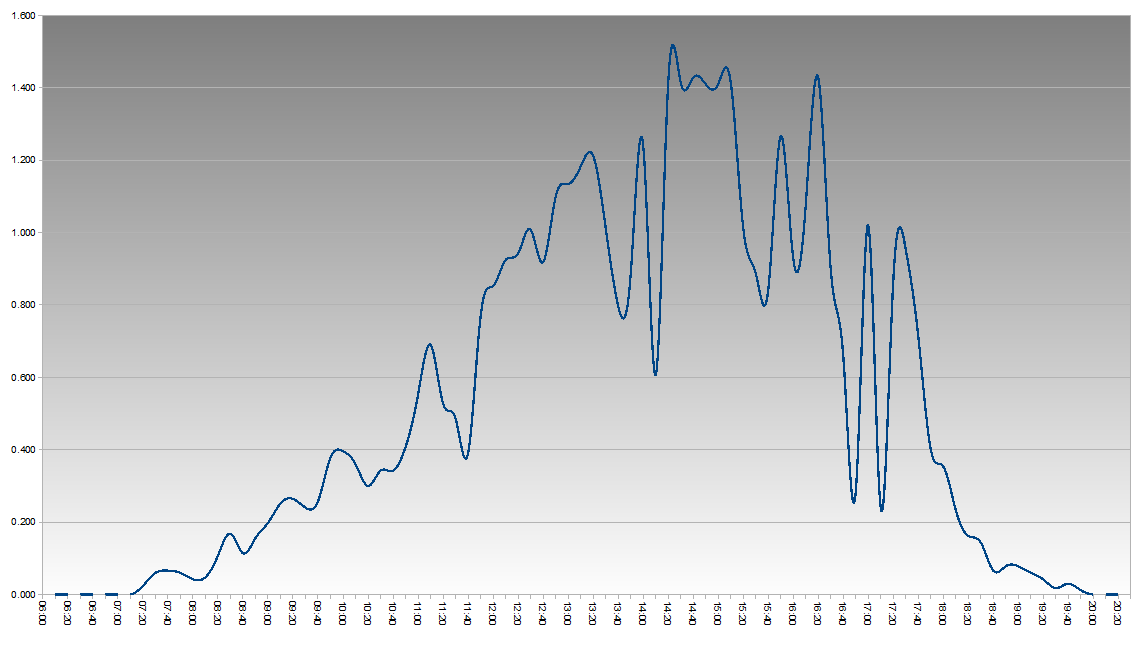
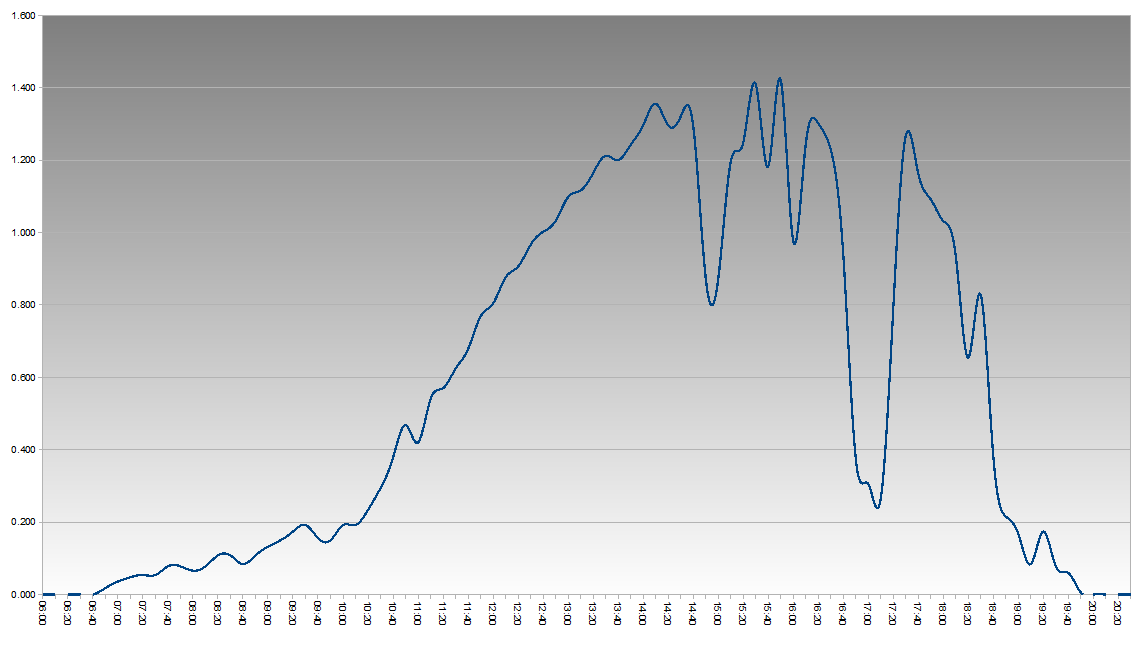
Comparing yesterday (blue) to today (orange) you can see that while today started generating earlier, it didn’t reach quite the same peak between 12:40-1:40pm and there was a big dip from around 4:40-5:40pm which probably explains this lower figure:

(View Large)


Power generated today: 8.364KW

Power generated so far: 75.103KW


Day 14 – How much?!

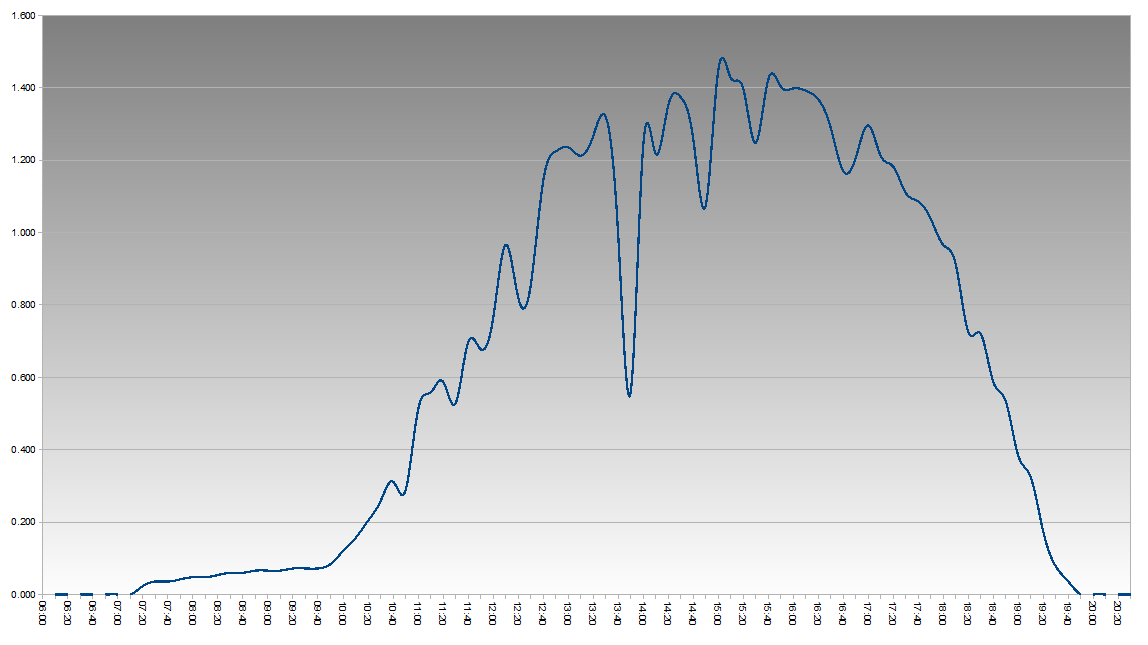
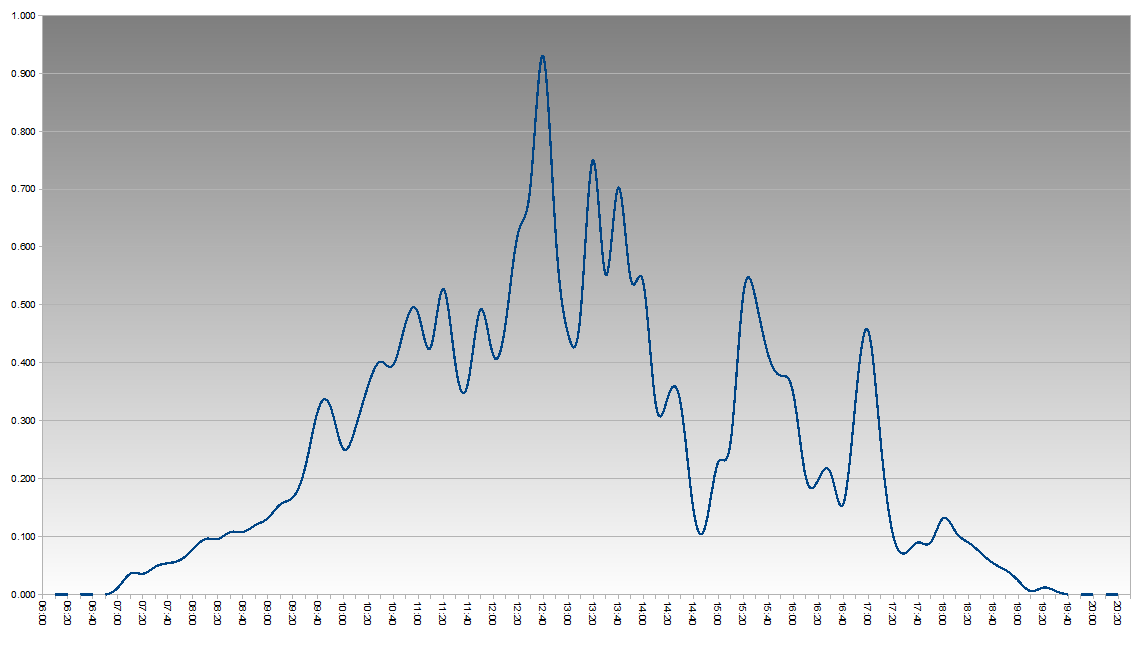
Today was an amazing day for power generation – just over 9KW!   Apart from a few small dips it looks like it generated the best possible amount for this time of year and the graph is an almost perfect curve so hitting the peak level possible for that time at a lot of points: (Note that you can click on the picture above to see the undistorted graph).


Power generated today: 9.034KW

Power generated so far: 66.739KW

Day 13 – End of August

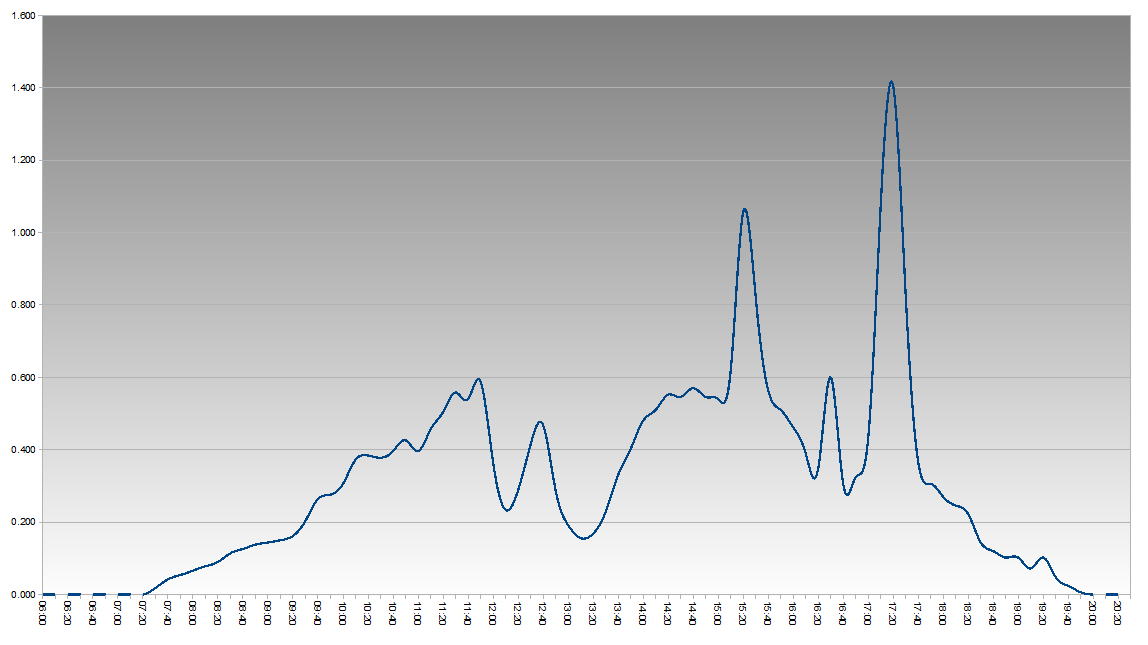
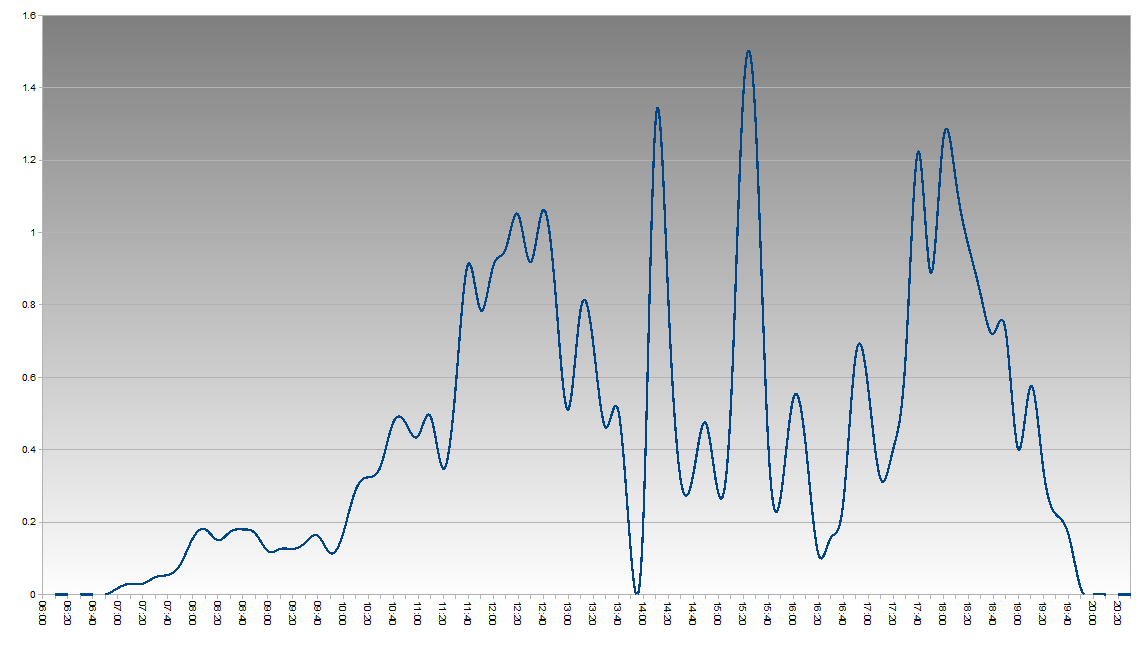
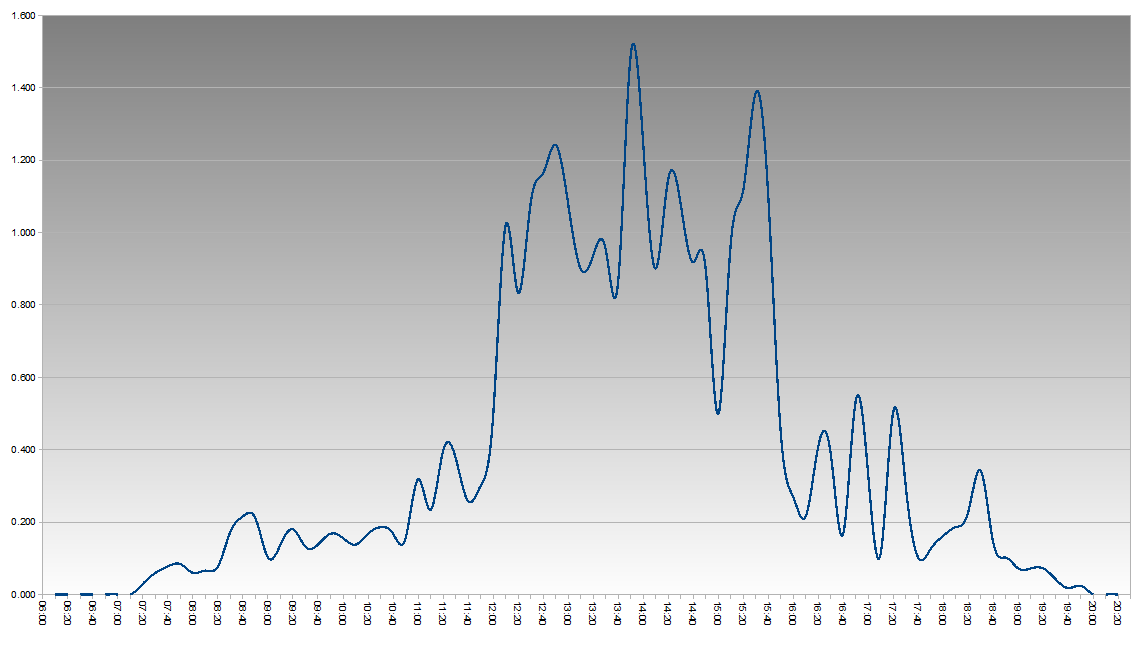
Today stated off dull, but improved later – although as you can see there were big jumps at around 3:30pm and 5:30pm, the rest was still cloudy:

I got my MCS certificate today, which I need to send to my electricity company to get paid for what I generate plus the electricity I have already been putting back onto the grid.  Already I think I’m up to £30 I’m owed.


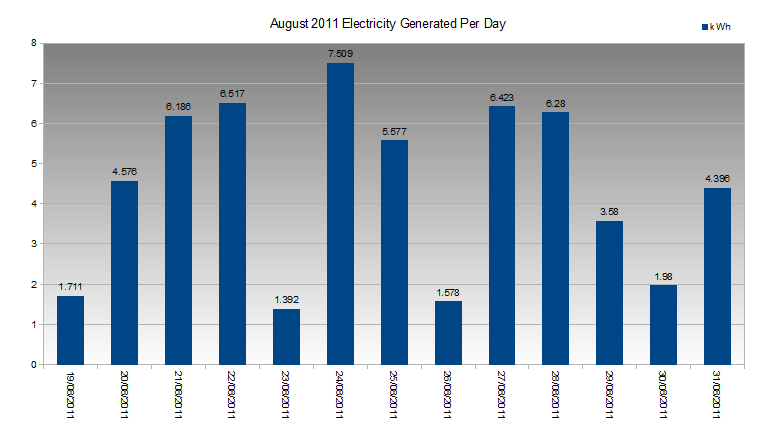
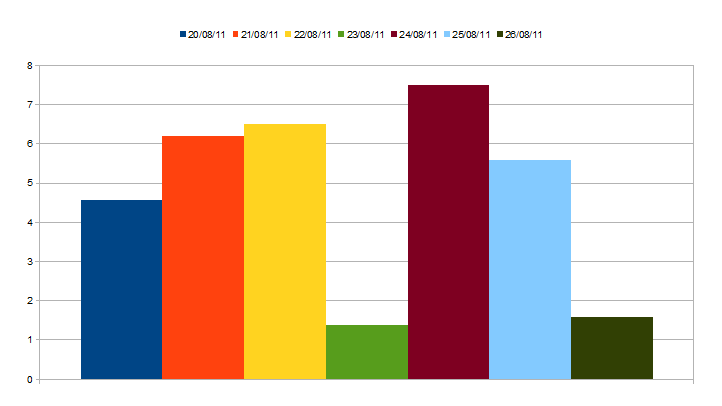
Looking back at August there’s been a range of values across the days (remember that Friday 19th was only generating from 5pm so was actually quite a good day for solar energy):

So far I am pretty impressed how it’s going.  Dull, cloudy days are disappointing, but the sunny ones more than make up for them. 🙂


Power generated today: 4.396KW

Power generated so far: 57.705KW

Day 12 – Grey

Another grey day.  Not the worst day we’ve had, but definitely among them.

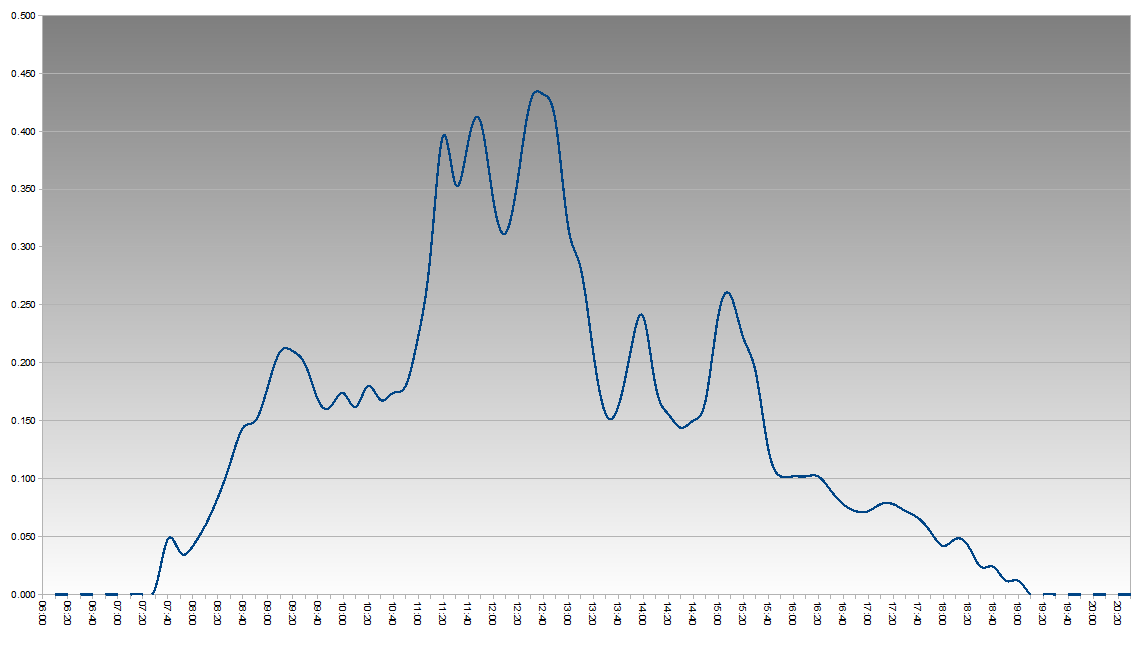
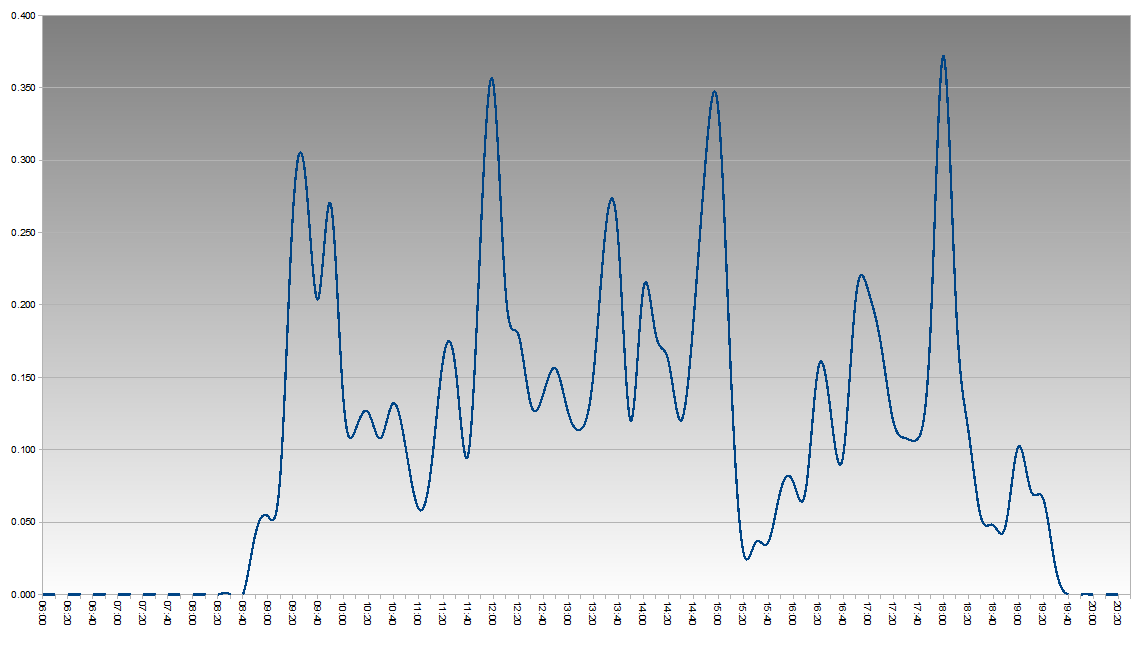
The graph below looks like it has a big peak, until you look to the left and see that the highest peak is 0.432KW, which has normally already been exceeded by 12 noon.  It does allow you to see the detail of the start and end of the day, which is usually too small to make out on the other graphs:

Power generated today: 1.980KW

Power generated so far: 53.309KW

Day 9

So, the second Saturday we’ve been generating electricity.  Today was a mixed bag, but overall generated a decent amount of electricity: The dips just before 2pm and 4pm were when we had rain showers, the latter also included hailstones which came down so hard we could see them bounce!


Power generated today: 6.423KW

Power generated so far: 41.469KW

Day 6

Today was the best day so far for electricity generation.  It was bright and sunny almost all day, and you can see from the graph that there were only a few dips, probably just the occasional cloud:

In fact the amount generated exceeded our average usage.  🙂


Power generated today: 7.509KW

Power generated so far: 27.891KW