2011’s power generation in review

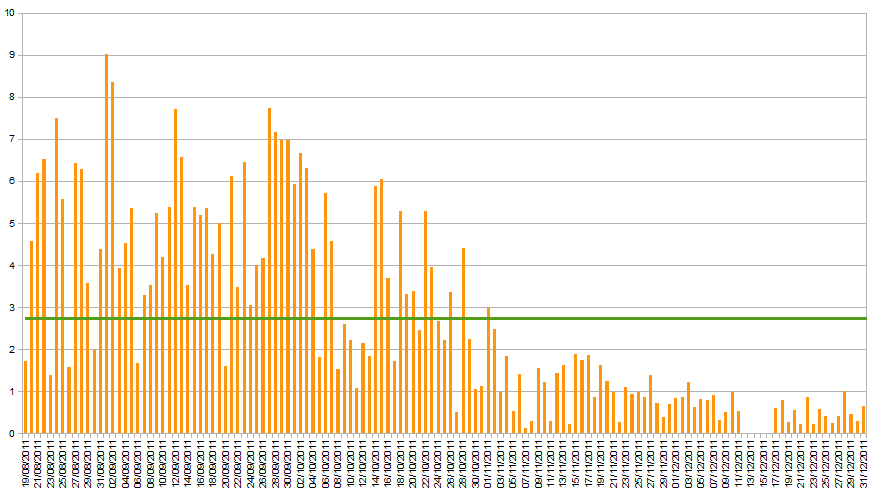
Looking back at 2011, it is interesting to see the difference between daily generation totals the months before November and those during November and December.  You can pretty much draw a line between the 2nd and 3rd November to separate the two levels.

The green line of the chart shows the average (mean) value of daily generation – about 2.7 kWh.  Given we had the panels fitted late in summer, I’d expect 2012 to be a higher average.

Looking back at January and December

I’ve realised that I didn’t produce a graph for the month of December, so I will be looking at both December and January in this post.

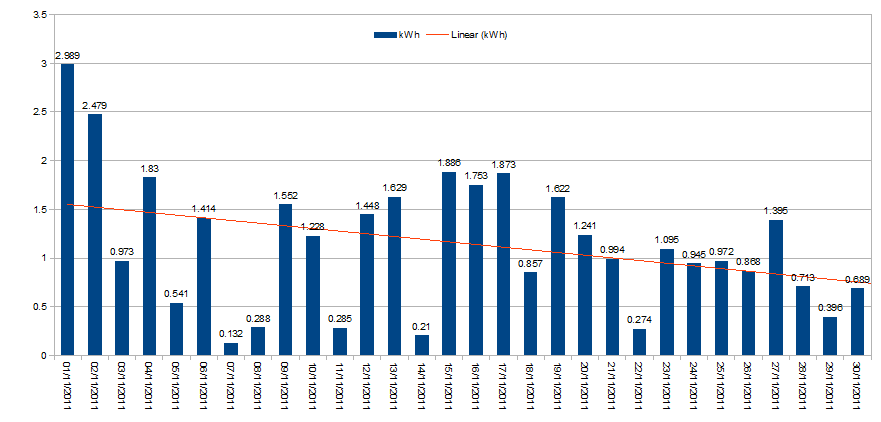
When I looked at the power generation graph for November, the overall trend-line was going down.  In December this trend continued with the trend dropping from about 0.7 to less than 0.4 kWh generated per day.  There were a few days where we reach near to or exceeded 1 kWh, but a lot of the days were fairly grey.  For 5 days (12-16th Dec) our wireless (Sunny Beam) display had a flat battery because I’d not connected it for a week or so to charge it, but it generated approximately 3 kWh during those days (i.e. an average of about 600 Wh each day) which is not reflected in the graph below and the lack of those values will almost certainly have skewed the trend downwards.
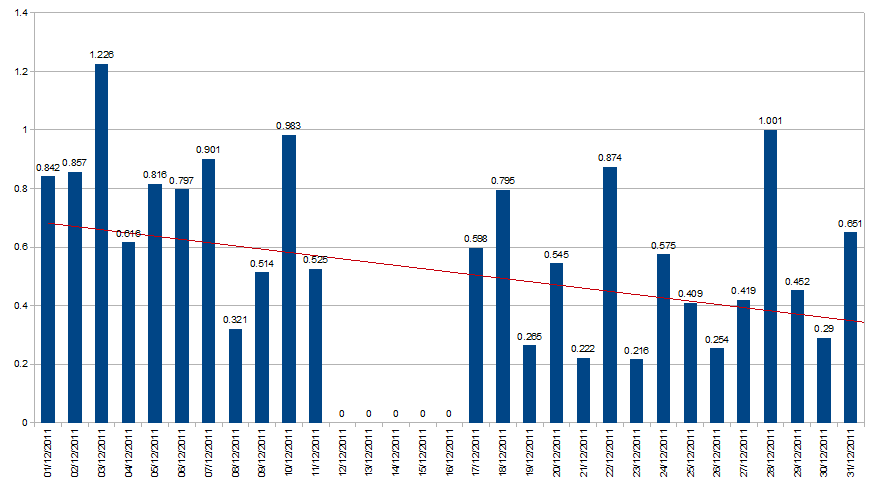
 

In January however, the trend line on already on its way up – note that the zero figures for the 10th, 11th and 12th are, like in December, an error where no figures were recorded because the device’s battery ran out. In both cases though, they were still recorded in the total by the official meter.  It looks like those missing days in January averaged about 400 Wh each (i.e. about 1.2 kWh total).
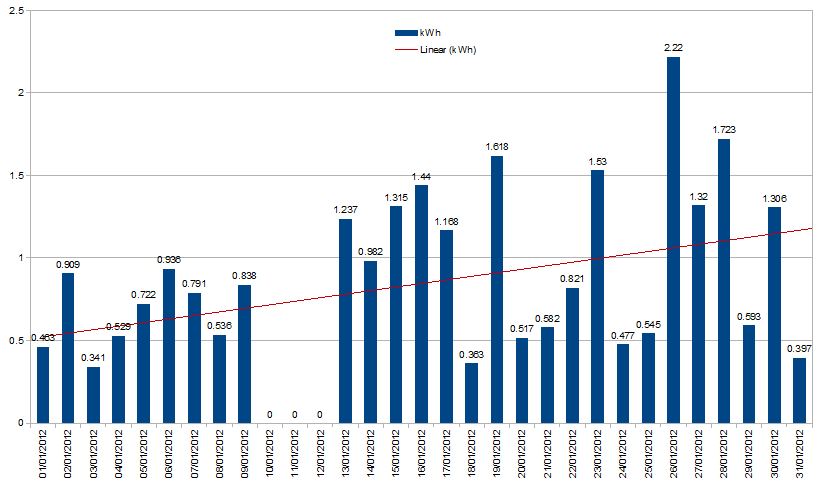
 

Even without those figures the trend increased from just over 0.5 kWh to about 1.2 kWh.  26th January was, as previously posted, the highest generation figure of 2012 (and the highest since the first two days of November) at 2.22 kWh.
Update on the legal challenge to the Government’s change to the FIT rate

The BBC reports that “…the government has failed in an appeal against a decision which blocked its attempts to reduce solar subsidies… However, the government has said it will seek leave to take the case to the UK’s Supreme Court”.

What this appears to mean is that those who have or had solar panels fitted between 12th December 2011 and 3rd March 2012 will have to wait until either the bid to take it to the Supreme Court is rejected, or the case is heard there and a decision made, before they will know what rate they are going to be paid.  Recent legislation does however mean that after the 3rd March the feed-in tariff rate for new installs will be 21p per kWh.

Further news about the reduction of the FIT rate

There’s been a few stories relating to the Government’s reduction of the feed-in tariff from the 12th December:


“Jobs warning over solar energy changes”

http://www.bbc.co.uk/news/uk-wales-16132726

– more details about the impact of the reduction.


“Church and charity warn on solar”

http://www.bbc.co.uk/news/science-environment-16304817

“The Church of England and the National Trust have written to the government saying recent policy changes put community solar power schemes at risk…”


But in the last few days:

“Solar tariff cut plan ruled legally flawed”

http://www.bbc.co.uk/news/business-16291768

“Government plans to cut subsidies for solar panels on homes have been ruled legally flawed by the High Court…”


The impact of this is yet to become clear, or if it will actually make any difference to anyone, but it may result in interesting news early next year.

Government announces changes to FIT for new installs from December 12th

The Government has announced that the feed-in-tariff rate will be reduced for newly registered installations from the 12th December to 21p/kWh:

http://www.clickgreen.org.uk/news/national-news/122745-government-confirms-plans-for-december-cut-off-for-feed-in-tariff-solar-rates.html

This will not affect me, or others who are already registered on the FIT scheme, but I think that such a significant cut (currently it is 43.3p/kWh) will be a real disincentive for those looking to invest in solar power.  I am primarily talking about householders – I have not been happy about the companies who have jumped on the bandwagon of offering free panels to profit from the feed-in-tariff.  I think the Government should encourage companies who are not being paid to fit them by householders to invest in the larger megawatt-sized schemes instead, and if necessary the “rent-a-roof” scheme should be banned for the under 4/8/12kW schemes.  Unfortunately the Government’s cut earlier in the year to installations larger than 50kW has already resulted in most companies that were planning to invest in the larger schemes dropping out or cancelling their projects.

This is also going to impact on the ability of the solar panel fitting industry, which was still in its fledgling stage.  Already they are laying off staff or leaving the scheme, where it wasn’t their primary business.  After being burnt once, I suspect it will take a long time before some of them would want to go back into this area.  Also it will take a while before it becomes a worthwhile investment on a reasonable time-scale for households – doing a quick estimate, the payback time for an installation the same as ours would change from 10 to 15 years, which would have definitely made me think again about going ahead.

A month in review: October 2011

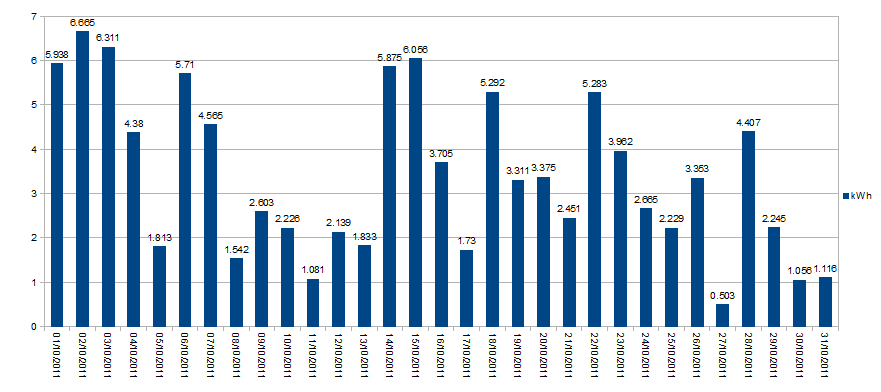
After the hot start to October, it’s been a bit more of the tradition mix of warm and cold day, with some noticeably grey ones, resulting in several days below 2Kwh total, and with significant dips during the day and thus relatively low figures.  The 27th, when only 0.5Kwh was generated was the worst generating day so far:


To date we have generated 320Kwh and saved over 158kg of CO2.  Comparing October to September, in September the average kWh generated per day was 5.18, in October it was 3.40.