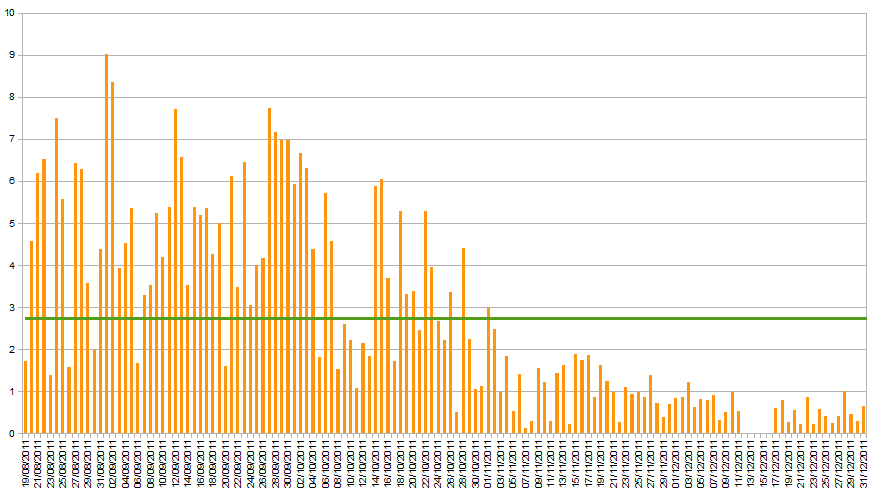
Looking back at 2011, it is interesting to see the difference between daily generation totals the months before November and those during November and December. You can pretty much draw a line between the 2nd and 3rd November to separate the two levels.
The green line of the chart shows the average (mean) value of daily generation – about 2.7 kWh. Given we had the panels fitted late in summer, I’d expect 2012 to be a higher average.
