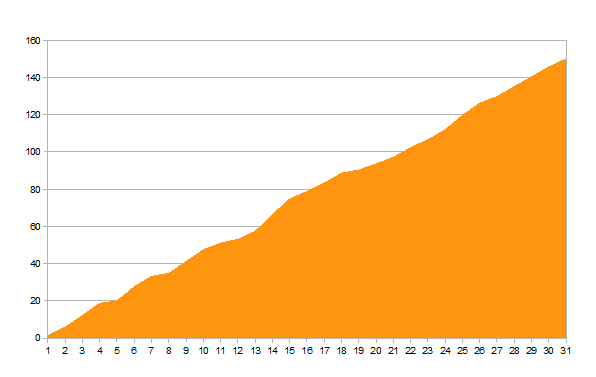
So we’ve had our solar panels for a month now, and yesterday (the 18th) we reached 150KWh generated.
 Looking at the cumulative power generation over the month, I was surprised that the line is straighter than I expected – although you can see some of the plateaus.
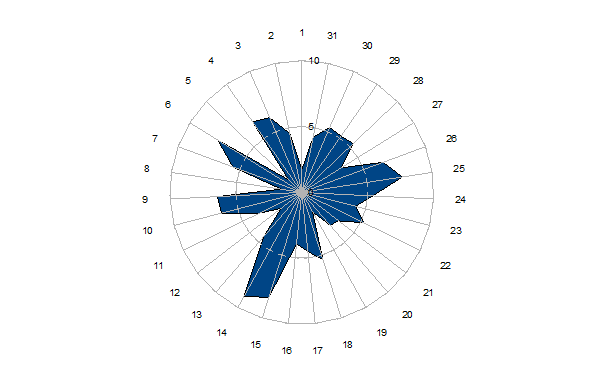
More interesting is the polar view graph, showing the higher generating days quite clearly, and the sudden drops inward on the less good days:
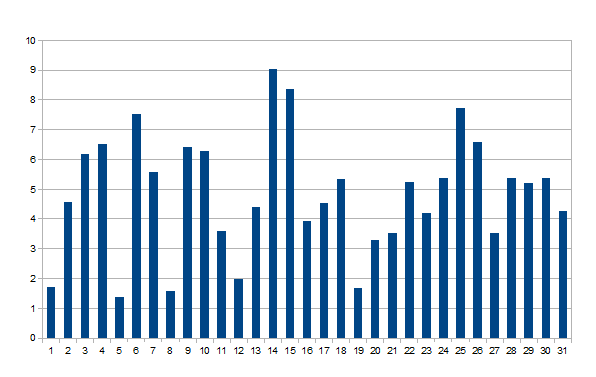
Finally is the more traditional bar graph of the last month:

