So it’s been just about 3 years since I last posted. We recently crossed 7.7 Mwh generated, and in recent news the UK generated 7,000 gigawatt hours (Gwh) from solar between April and September, which was 10% more than the coal-fired power plants produced in the same time: http://www.independent.co.uk/environment/solar-panels-electricity-coal-power-stations-uk-sun-a7344326.html.
Over 3 Megawatts and Updated Monthly Generation Figures
So, a couple of months ago we passed the 3 Mwh generation mark.
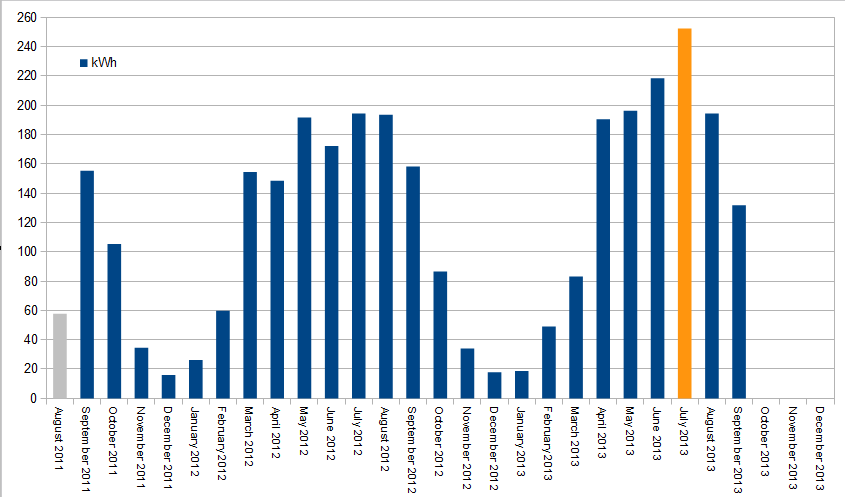
Below is a graph of the generation figures from installation until the end of September, by month. July this year was the best generating month to date.
The Sun is back, hurrah!
So, now that the sun is back, we’ve been generating between 8 and 11 kWh each day since the beginning of May. This is having a noticeable effect on our daily electricity costs (where we’ve been using 12-14 kWh per day) and our usage is likely to come down as we turn on the lights later and later, and don’t need to use the tumble dryer to get our clothes dry.
| Date | kWh |
| 01/05/2013 | 11.336 |
| 02/05/2013 | 11.088 |
| 03/05/2013 | 9.251 |
| 04/05/2013 | 8.053 |
2 Megawatts!
As of yesterday evening, we have generated 2 Mwh of electricity with our solar panels! 🙂
2012 in review
So, 2012 was generally a good year for our power generation. The total was 1437.6 kWh, slightly under the original estimate of 1460 kWh for the year; although the start of 2012 our power monitor’s battery went flat so at a guess the actual figure is 3-6 kWh higher.
The start of 2013 was pretty poor, with grey skies and rain affecting power generation (and the cold affecting both us and our gas use). Fingers crossed that it improves soon.
August in Review
While the weather in August was decidedly up and down (prompting the headline: “Summer ‘wettest in 100 years’…” ), August was still great for generating electricity most of the time, resulting in 193.541 kWh – our second highest month for power generation (July still retains top spot). The graph for August is below:

For ease of calculation, I will be using 1st September as the start of year date going forward, so have included a graph of the months so far below:

1.5 MWh!
So, just over a week after our 1 year anniversary of having solar panels, yesterday we’d generated a total of 1.5 megawatt hours. It’s hard to believe that it’s only been less than two and a half months since we reach 1 megawatt hour, although obviously the power generation is at its most in the summertime.
A year of solar panels
Looking back on the past year, I’ve been really pleased that I bought solar panels and that I did so when I did.
Given the issues on the first day after installation, that means that really it is a year today rather than yesterday.
So, how much have we generated in a year? The answer: 1463.4 kWh, which is just over the prediction of 1460 kWh. In that time we’ve also used approximately 1700 kWh from the grid (exact figure to follow), but that means that we cover a significant percentage (although less than 50%) of our electricity usage from solar power. As well as the solar power reducing our bills, we have also generally reduced our electricity usage by about 600 kWh compared to the year before we had the panels installed. With recent changes in appliances, it is likely that we have reduced usage still further.
The year to date (note that both Augusts are not full months):

So, it’s been a year…
I was hoping to post the figures for one year of usage of our solar panels, however we decided to go away at the last minute for a break this weekend. Hopefully I’ll post figures on Sunday night or Monday.
July in Review
July was a good month – the best so far with 194.392 kWh (May was the previous best with 191.655 kWh), although there were a few disappointing days, including the last day of the month.

The best days for power generation were still 25th and 26th May with 11.344 kWh and 11.268 kWh respectively, however the 22nd July was still a very respectable 11.115 kWh.